Key findings
- September final-demand PPI rose 1.3% seasonally adjusted; August is revised to 0.5%.
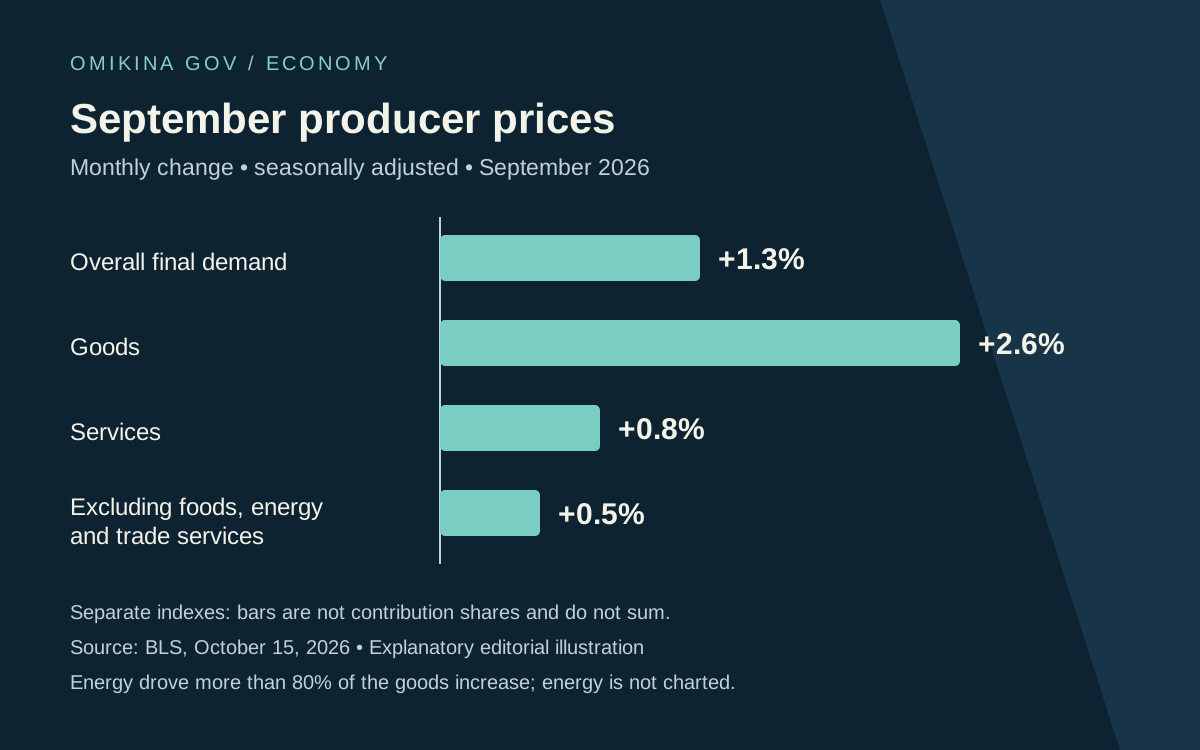
- Energy explains more than 80% of the goods-price increase, according to BLS.
- The statistical release does not estimate an agency-specific purchasing cost.
What remains open
- Which price series and adjustment clauses apply to the public contracts being evaluated?
- How do actual agency invoice prices compare with the relevant producer-price series?
What changed in the original record
The Bureau of Labor Statistics reported on October 15 that final-demand producer prices increased 1.3% in September after seasonal adjustment. The same release puts August at 0.5% and July at 0.2%. Its revision note covers May through August. Comparisons with an older indicator summary therefore need the revised August figure, rather than treating a previously displayed number as the current baseline. [1]
Goods prices rose 2.6%, services 0.8%, and final-demand energy 10.8%. BLS attributes more than 80% of the goods increase to energy. The measure excluding foods, energy and trade services rose 0.5%. These are changes in different indexes, not percentages that can be added together or treated as contributions to the headline. [1]
The release reports a 6.3% rise in overall final-demand prices over twelve months, without seasonal adjustment. Our reading is that the sharp monthly headline deserves attention alongside its composition and revisions. The release alone does not identify the cause of every price change or establish the price of an individual government purchase. [1]
What the measures actually describe
The technical notes define final demand as sales for personal consumption, capital investment, government and export. Intermediate demand instead concerns business inputs to production, excluding capital investment. This distinction matters when reading a public budget: an economy-wide final-demand index includes government purchases, but it is broader than a government procurement basket or the spending of any particular agency. [2]
Trade-service indexes measure wholesalers’ and retailers’ margins. A change in that component therefore describes a different pricing concept from a change in the selling price of a physical good. For oversight, the first question should be which service or product a comparison covers, before deciding that a broad index explains a particular invoice. [2]
BLS prefers seasonally adjusted data for analyzing general trends, while unadjusted data are generally used for long-term contract escalation. Our analysis is that the adjustment basis belongs beside every comparison. Applying a headline monthly rate directly to a contract without checking its terms would skip that methodological distinction. [2]
The purchasing question still needs contract evidence
BLS describes PPI as measuring selling prices received by domestic producers. Its overview distinguishes that perspective from prices paid by purchasers; distribution costs, taxes and subsidies can separate the two. Accordingly, this release provides context for purchasing pressure, while an actual claim about an agency’s costs would require the items bought, quantities and prices it paid. [3]
The overview identifies contract adjustment as a use of PPI and illustrates an agreement tied to the relevant input index. That supports a practical evidence request: identify the contract’s chosen series, reference period and adjustment clause, then reproduce the calculation. It does not establish that any named federal contract automatically changes when the overall PPI changes. [3]
The next useful follow-up is a documented comparison between a relevant price series and an actual purchasing agreement. We have not examined procurement files, invoices or agency budget revisions for this article. Its conclusion is limited to a verified statistical change and an explanation of how to investigate its purchasing significance; no government-wide dollar impact is estimated. [3]
The evidence file
Sources & evidence
Read the original records behind this analysis. Dates below distinguish publication from retrieval.
Published October 15, 2026. Retrieved October 15, 2026.
Publication date not supplied. Retrieved October 15, 2026.
- Producer Price Index — overview bls.gov
Publication date not supplied. Retrieved October 15, 2026.
How this article was prepared
AI assisted the research and writing of this original analysis. It is grounded in the linked public sources. Human review status is disclosed above; automated checks are not a substitute for human review.
Editorial standardsCorrections policy