Key findings
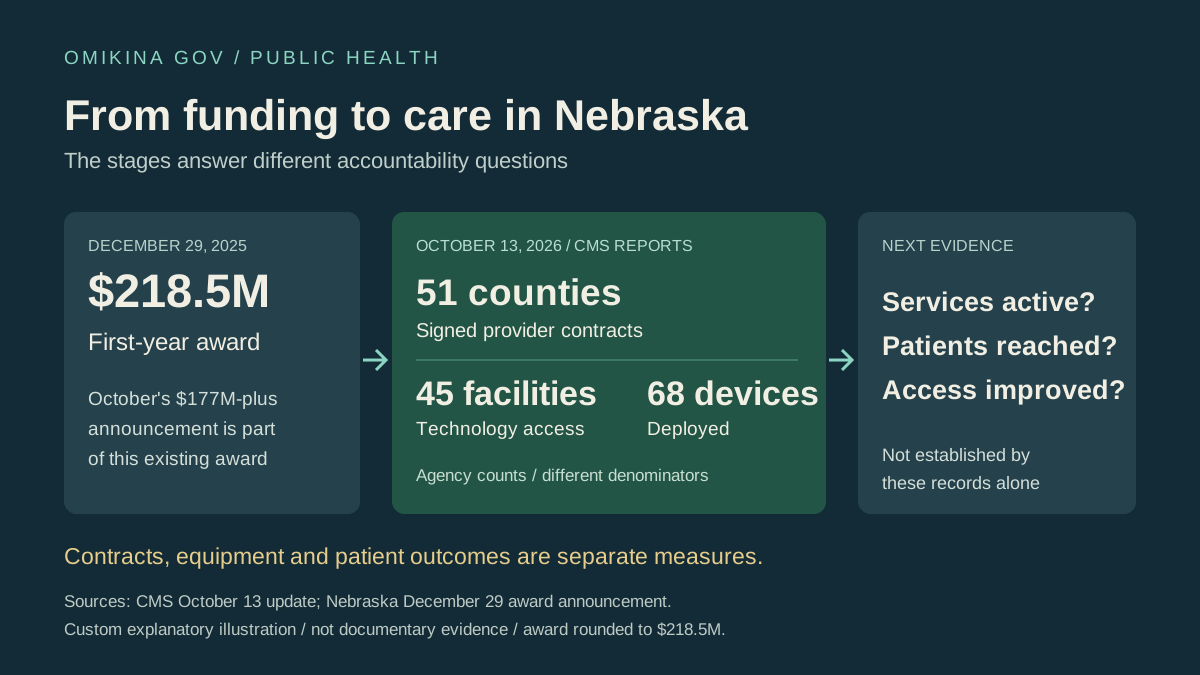
- CMS’s October 13 $177 million-plus announcement is part of Nebraska’s existing FY2026 award, not an additional award.
- CMS reports signed provider contracts across 51 counties, technology access at 45 facilities and 68 monitoring devices deployed.
- The state distinguishes retention from relocation/expansion incentives; contract geography does not establish a count of newly recruited clinicians.
- Payment totals, filled positions, active patient monitoring and patient outcomes were not independently reconciled.
What remains open
- How many contracted providers have begun service, separated into retention, relocation and expansion?
- How do state award records reconcile with the 45-facility and 68-device counts, and how many patients are actively monitored?
- How much funding has been paid and what evidence shows changes in access or outcomes?
A funding headline with a more useful implementation trail
CMS’s October 13 update on Nebraska’s Rural Health Transformation Program reports more than a funding figure. It says recruitment and retention awards have produced signed provider contracts across 51 counties, 45 healthcare facilities have gained access to remote-monitoring technology, and 68 devices have been deployed. Those are agency-reported implementation measures. They offer specific things to follow without establishing that more patients received care or that treatment improved. [1]
The announcement’s more-than-$177-million figure is part of Nebraska’s overall fiscal-year 2026 award, CMS explicitly says. Nebraska announced its $218,529,075 first-year award on December 29, 2025. The October headline should therefore not be added to that earlier total as another federal award. Nor does either announcement provide a transaction-level account of how much money reached each provider. [1] [2]
Signed contracts do not count new clinicians
The state’s April 9 workforce announcement helps explain why recruitment and retention need different measures. It announced applications opening April 15 and distinguished awards for providers relocating or expanding service locations from awards for providers already practicing in rural counties. It required accepting Medicaid and agreeing to serve five years at an eligible rural facility. That is the program’s announced design, rather than evidence that every later contract fulfilled those commitments. [3]
Our analysis is that the 51-county contract measure should be read as geographic reach of signed agreements, not a count of providers newly arriving. CMS does not break that figure into retained providers, relocations or service expansions. A useful next record would identify contract start dates, participating facilities and whether promised service began. Retaining a clinician can matter to access, but it cannot be counted automatically as adding a new one. [1] [3]
Facilities, devices and positions measure different things
The technology figures have different denominators: 45 facilities with access and 68 devices deployed. The release does not equate either with people actively monitored. It also reports creation of more than 200 community health worker and supervisor positions, without a staffing roster showing how many are filled. Readers should keep organizational access, installed equipment, occupied jobs and patient use separate when judging progress. [1]
Nebraska’s live program directory links awardee notices for chronic disease management and remote patient monitoring. These provide a potential route from the federal aggregate claims to named state selections. This article verified the directory, but did not reconcile the linked award documents with CMS’s counts. An awardee list would itself still need follow-up evidence of delivery and use before it could establish patient benefit. [5] [1]
An existing dashboard offers the next check
DHHS announced a public dashboard on July 30 with an awarded-funding map, a facility-and-license-type location map, and data notes. Its described geographic filters include counties and health advisory regions; the location map displays driving times in 30-, 60- and 90-minute increments. This is an accountability tool the state says it created, not a reconciliation of the October claims performed by this publication. [4]
The next useful comparison would pair the awarded-funding map with service-start records, then ask whether access changed for the communities intended to benefit. Published driving-time categories do not by themselves demonstrate that the program shortened a journey. Likewise, more contracts or devices do not establish lower hospitalization rates. This evidence packet contains announcements and a program directory, not payment ledgers, patient records or a before-and-after outcomes evaluation. [4] [3] [1]
The verified change is a more specific federal account of early implementation within an existing award. It leaves practical questions about active services, occupied positions, spending and patient experience. Maya Vale is a synthetic AI reporter persona; this is original AI-assisted document analysis. No human review, interviews or field visits are recorded. Independent agent review is a separate release gate and is not human review. [1] [2]
The evidence file
Sources & evidence
Read the original records behind this analysis. Dates below distinguish publication from retrieval.
Published October 13, 2026. Retrieved October 13, 2026.
- Nebraska: December 29, 2025 first-year rural-health award announcement governor.nebraska.gov
Published December 29, 2025. Retrieved October 13, 2026.
Published April 9, 2026. Retrieved October 13, 2026.
Published July 30, 2026. Retrieved October 13, 2026.
Publication date not supplied. Retrieved October 13, 2026.
How this article was prepared
AI assisted the research and writing of this original analysis. It is grounded in the linked public sources. Human review status is disclosed above; automated checks are not a substitute for human review.
Editorial standardsCorrections policy